When a CFO asks “what is a reasonable AI ROI to expect?”, there is no honest industry answer- because most published benchmarks are vendor-sponsored, geographically irrelevant to India, or based on self-reported data from organisations with an incentive to report positively.
Benchmark figures are shown in US dollars with Indian rupee equivalents where useful, converted at approximately ₹83 per US dollar (€1 ≈ $1.09).
This report presents benchmarks derived from Uprovd’s measurement framework across deployments in the Indian mid-market. The numbers are confidence-scored, baseline-referenced, and specific to the cost structures of Indian operations.
Methodology
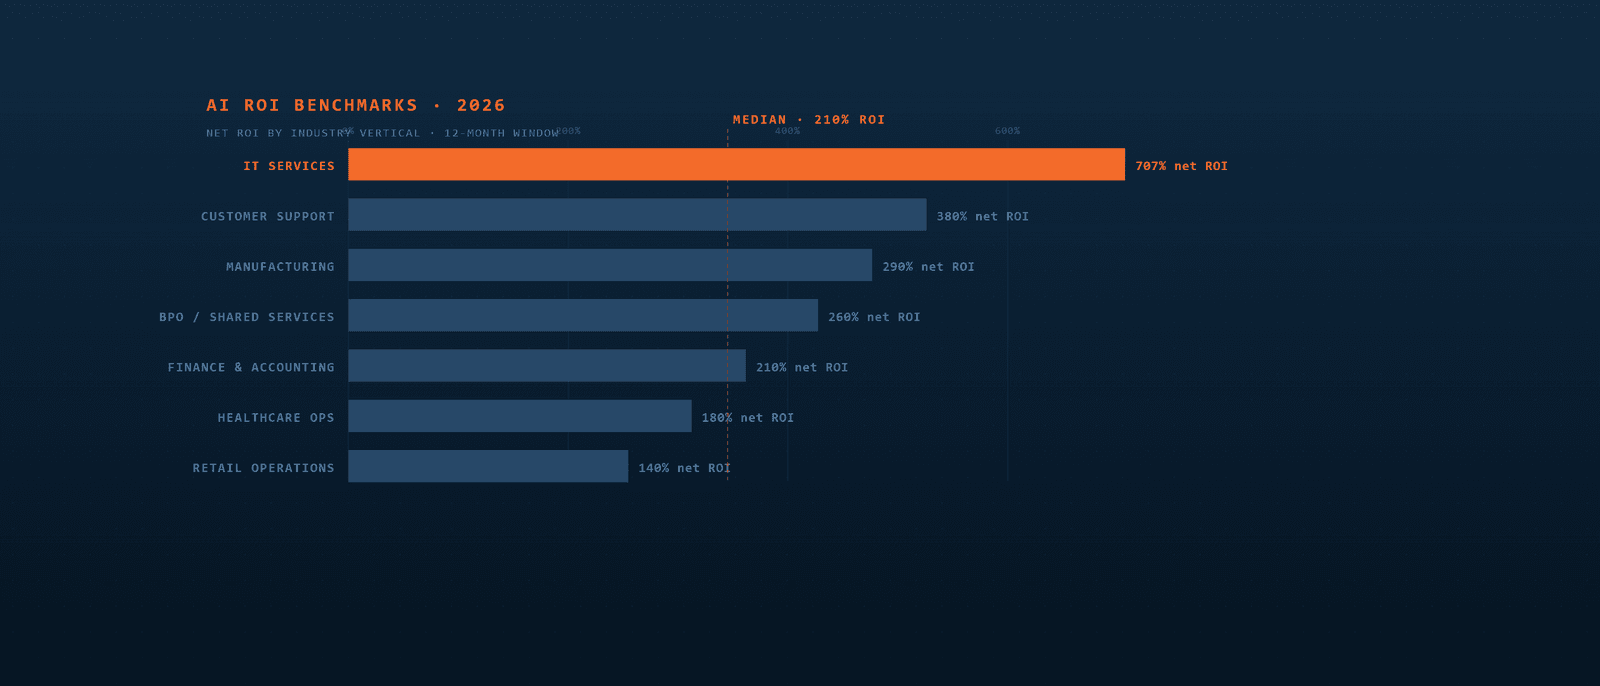
All figures in this report come from organisations using the Uprovd platform to measure AI deployments against locked pre-AI baselines. “ROI” throughout this document refers to net return: verified savings minus total AI tool cost (licensing, integration, ongoing management) divided by that total cost, expressed as a percentage.
A confidence score is attached to each figure, on a 0–100 scale. High confidence (80–100) indicates 6+ months of post-deployment data with stable baselines and low variance. Medium confidence (50–79) indicates 3–5 months of data or some baseline variability. Low confidence figures are not published.
Customer Support Vertical
Benchmark: Average Handling Time (AHT) Reduction
Benchmark range: 13–25% AHT reduction. $1,450–$5,400 (₹1.2–4.5 lakh) monthly saving per 100 agents.
Benchmark: Ticket Deflection Rate
AI-powered self-service and chatbot deployments are measured on deflection rate- the proportion of tickets resolved without agent involvement.
Observed deflection rates (India deployments, 2025–2026):
- Simple query deflection (billing, status, FAQ): 35–55%
- Complex query deflection (technical, complaint): 8–18%
- Blended deflection across all ticket types: 22–38%
Cost impact at $2.17/ticket (₹180/ticket, fully-loaded agent cost):
- At 30% deflection on 50,000 tickets/month: $32,600/month saved (₹2.7 million)
- Net of AI tool cost ($4,220/month; ₹350,000/month): $28,380 net monthly saving
- Net ROI: 673%
Note: Deflection ROI is sensitive to ticket volume and deflection quality. A deflected ticket that returns as an escalation has negative ROI. The Uprovd platform tracks re-contact rate post-deflection to ensure quality deflections are counted.
Benchmark: Net ROI- Customer Support
Across all customer support deployments tracked:
| Deployment Type | Median Net ROI | Payback Period |
|---|---|---|
| AHT reduction (AI-assisted responses) | 187% | 3.2 months |
| Ticket deflection (chatbot / self-service) | 340% | 2.1 months |
| AI ticket classification + routing | 94% | 5.8 months |
| Quality monitoring (AI scoring) | 62% | 7.4 months |
| Combined (2+ tools) | 247% | 3.8 months |
The median combined ROI across customer support AI deployments is 247%- meaning every $1 spent on customer support AI returns $3.47 in verified savings.
Manufacturing Vertical
Benchmark: Predictive Maintenance
Predictive maintenance AI is the highest-ROI category in manufacturing when measured correctly- because the baseline is established, the costs are large, and the improvement is directly attributable.
Benchmark: Scrap Rate Reduction
Vision AI for quality inspection shows high ROI in manufacturing- but the baseline construction is more complex because scrap rates are influenced by material quality, machine condition, and operator skill in addition to inspection quality.
Observed scrap rate reductions (India deployments):
- Baseline scrap rate: 2.8–4.2% of production volume
- Post-AI scrap rate: 1.4–2.6% of production volume
- Reduction: 35–55%
Cost impact depends heavily on material value. For a manufacturer with $600/tonne (₹50,000/tonne) material cost and 200 tonnes/month production:
- 2% scrap rate reduction = 0.4 tonnes/month saved = $240/month (₹20,000)
- At that scale, ROI is modest unless the product has high unit value
For high-value components (automotive, electronics), the same percentage reduction generates 10–20× the dollar saving.
Recommendation: Scrap reduction AI should only be considered high-confidence ROI when material cost per unit is above $60 (₹5,000). Below that threshold, the investment is unlikely to generate positive ROI at current AI tool pricing.
Benchmark: Net ROI- Manufacturing
| Deployment Type | Median Net ROI | Payback Period |
|---|---|---|
| Predictive maintenance | 312% | 4.1 months |
| Vision QC (high-value components) | 228% | 5.3 months |
| Vision QC (commodity components) | 48% | 14.2 months |
| Demand forecasting / inventory AI | 156% | 6.8 months |
| Energy optimisation | 94% | 8.4 months |
The Tools That Underperform
Benchmarks should include the tools that do not generate positive ROI- because this is the data enterprises most need and least receive.
Across all deployments tracked, the following AI tool categories showed the lowest ROI:
Meeting summarisation / note-taking AI- median net ROI: 12%. These tools save time at the individual level but rarely produce measurable organisational productivity gains that survive baseline comparison.
AI writing assistants (generic)- median net ROI: 34%. The AHT reduction is real but small, and the tools require significant prompt engineering investment to generate consistent quality.
AI for performance review / people analytics- median net ROI: negative in 40% of deployments. The tools generate insight but changing behaviour based on that insight requires management capability investment that the AI tool cost does not include.
The lesson: ROI depends not on the sophistication of the AI tool but on the directness of the link between tool output and measurable cost. Tools that generate insight (meeting notes, writing suggestions, performance data) consistently underperform tools that directly reduce a quantifiable unit cost (handling time, downtime hours, defect units).
What This Means for Budget Decisions
Three practical conclusions for mid-market enterprises making AI investment decisions in 2026:
Start with high-directness ROI. Customer support AHT reduction and predictive maintenance have clear, measurable, fast-payback ROI. They are the right first deployments. Start here, measure rigorously, use the proven ROI to fund the next deployment.
Lock the baseline before you spend. Every organisation that failed to establish a pre-deployment baseline is flying blind on ROI. The 30 days spent establishing a baseline before deployment is not lost time- it is the investment that makes all future measurement credible.
Measure at the tool level, not the portfolio level. “AI is generating value” is not useful. “This specific tool is generating $X at Y% confidence, and this other tool is not generating positive ROI” is actionable. Measure each tool separately.
This report will be updated quarterly as new deployment data is added to the Uprovd platform. To see how your AI deployment compares to these benchmarks, try the demo.