
This analysis applies findings from our 2026 research whitepaper to the India and GCC enterprise market, with a worked example and a regional five-component framework. For the full research base, including global benchmarks and the underlying methodology, read The AI Adoption Reality Check.
Every enterprise leader has a version of the same story.
Figures are shown in US dollars with Indian rupee equivalents, converted at approximately ₹83 per US dollar (€1 ≈ $1.09).
The board approved the AI budget. The tools were deployed. The vendor promised productivity gains. Six months later, the CFO asks: “What did we actually get back?”
Nobody has a clean answer.
This is not a technology problem. It is a measurement problem- and it is costing Indian and GCC enterprises hundreds of thousands of dollars every year in AI spend that cannot be justified, defended, or optimised.
The Scale of the Problem
Three data points frame the crisis:
$85,521 per month (about ₹71 lakh)- the average monthly AI spend per enterprise in 2025 (CloudZero State of AI Costs, 2025). This number has grown 36% year-on-year as organisations move from pilots to production deployments.
74%- the proportion of enterprises that cannot demonstrate tangible AI business value to their finance teams (Google Cloud AI ROI Study, 2025). Nearly three quarters of companies spending on AI cannot prove it works.
95%- the proportion of generative AI pilots that fail to reach production (MIT Sloan Management Review, 2025). The most common failure mode is not technical. It is the inability to demonstrate sufficient business impact to justify scaling.
The pattern is consistent: investment is happening at scale, measurement infrastructure is not keeping pace, and the gap is widening as AI budgets grow.
Why Measurement Fails
When Uprovd spoke to 40 operations and IT leaders across India and the GCC during our research phase, three root causes emerged consistently.
No pre-AI baseline was established. The single most common failure. Organisations deploy an AI tool and begin measuring performance- but have nothing to compare it against. Without a locked pre-deployment baseline, any claimed improvement is unverifiable. You cannot calculate delta without a starting point.
Metrics are too abstract. “Productivity improved by 15%” means nothing to a CFO making a budget decision. The measurement needs to be in currency- dollars, rupees, euros- specifically, cost avoided, revenue protected, or output increased- not in percentage improvements to operational metrics that the finance team cannot map to the P&L.
Measurement is manual and delayed. Many organisations rely on quarterly reports compiled by analysts who pull data from multiple systems. By the time the analysis is complete, the data is stale, the context is lost, and the decision-making window has closed.
The Baseline Problem in Detail
The baseline is the single most important element of any AI ROI calculation- and the most commonly absent one.
Consider a customer support operation deploying AI to reduce Average Handling Time (AHT). If AHT before deployment was 8.2 minutes and after deployment is 6.9 minutes, the improvement is 1.3 minutes. At $1.02 per agent-minute (₹85) and 50,000 tickets per month, that is $66,300 per month (about ₹55 lakh) in cost saved.
But this calculation is only valid if:
- The pre-deployment AHT of 8.2 minutes was measured under comparable conditions (same agent mix, same ticket complexity, same seasonality)
- The comparison period uses the same conditions
- Other variables (agent training, ticket type changes, system upgrades) are controlled for
Without a properly constructed baseline, the 1.3-minute improvement cannot be attributed to the AI tool. It could be seasonal variation, improved agent experience, or a change in ticket mix.
This is why Uprovd locks the baseline before deployment begins- capturing 90 days of pre-AI performance data as the reference point against which all subsequent measurements are compared.
What a Proper AI ROI Framework Looks Like
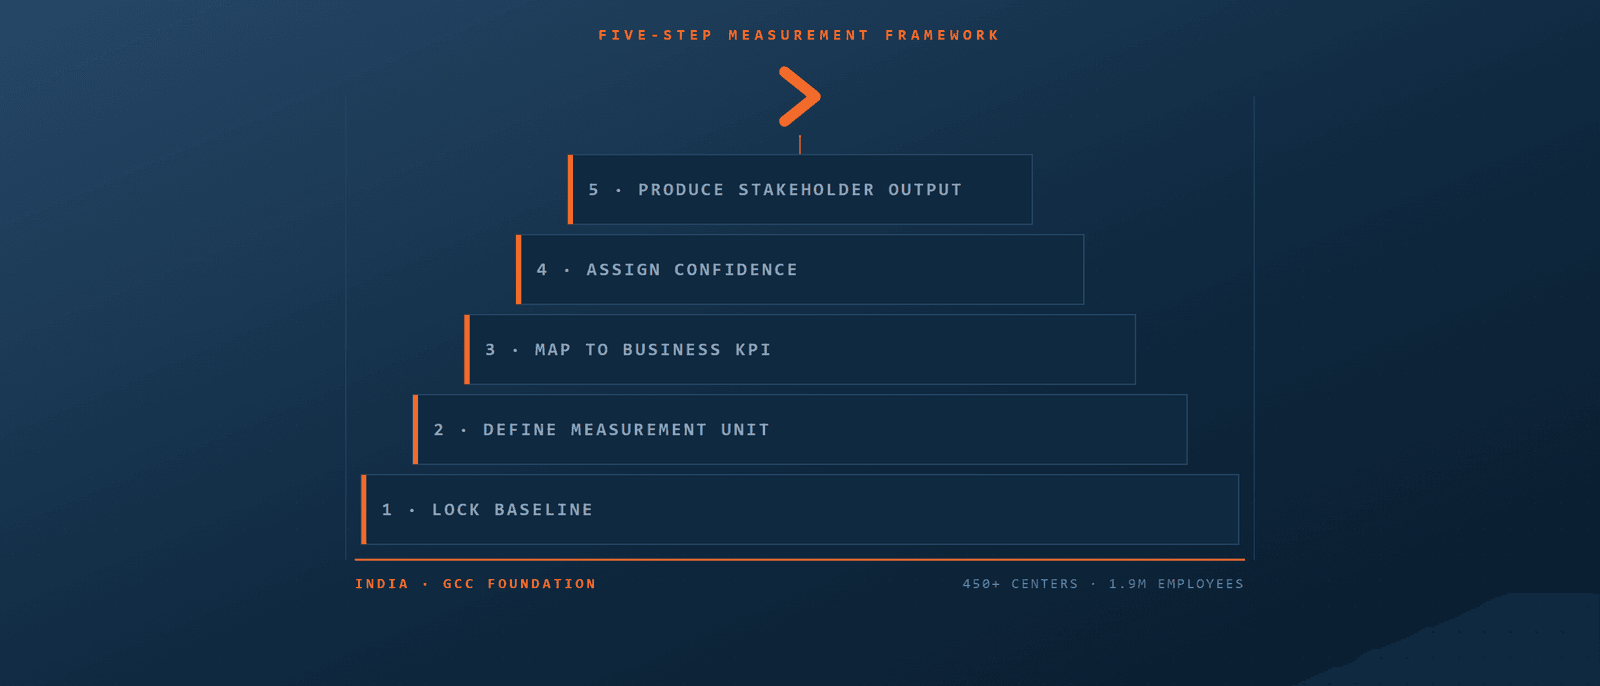
A credible AI ROI measurement framework has five components:
1. Pre-deployment baseline lock. A 60–90 day window of pre-AI performance data, captured across all relevant KPIs with consistent methodology. This is the reference point for all future calculations.
2. Industry-specific KPI selection. ROI looks different in customer support (AHT, deflection rate, cost per ticket) versus manufacturing (scrap rate, downtime hours, predictive maintenance cost). Generic BI tools apply the same formulas to every context. This produces numbers that are technically accurate but operationally meaningless.
3. Cost input transparency. Every formula must use the organisation’s actual cost inputs- agent hourly cost, material scrap value, machine downtime cost- not industry benchmarks. Benchmarks introduce assumptions that finance teams cannot verify and will not trust.
4. Confidence scoring. Every ROI calculation should carry a confidence score indicating how reliable the measurement is. A calculation based on 6 months of clean data with stable baselines deserves a higher confidence rating than one based on 3 weeks of data with significant variation. CFOs need to know which numbers to trust.
5. Actionable output. The final deliverable is not a data dump. It is a clear statement: this AI tool generated $X in verified value at Y% confidence. This tool did not. Here is what to do about it.
The Cost of Not Measuring
The measurement gap has three direct costs that are rarely quantified.
Budget renewal risk. When a CFO cannot verify AI ROI, the safest decision is to not renew the contract. Many productive AI tools are cancelled not because they fail- but because nobody can prove they succeed.
Missed optimisation. Without measurement, underperforming AI tools continue to consume budget. An organisation spending $14,400 per month (₹12 lakh) on three AI tools, of which only two are generating positive returns, is wasting $4,800 per month (₹4 lakh) that measurement would have identified.
Competitive disadvantage. Organisations that measure effectively can accelerate. They know which tools work, where to expand deployment, and which vendors to hold accountable. Organisations that don’t measure are flying blind while their competitors navigate with instruments.
The Uprovd Approach
Uprovd is built around a single premise: AI ROI measurement should be as rigorous and transparent as financial auditing.
Every calculation is formula-visible- you can click any metric and see exactly how the number was derived. Every output carries a confidence score. Every recommendation is based on actual performance data, not vendor claims.
The result is a CFO-ready report that finance teams can use in budget conversations without qualification or asterisks.
We currently support two verticals: Customer Support and Manufacturing- the two areas where AI adoption is deepest and ROI measurement gaps are most acute. Additional verticals follow the same framework and will be added based on customer demand.
Read next
This analysis is built on our 2026 research synthesis. For the complete framework, global benchmarks, and full bibliography, read The AI Adoption Reality Check, 2026 Uprovd Research Whitepaper.
To see this measurement framework applied to live data from a 200-agent BPO deployment, try the demo.