
Every IT services firm in India has the same story right now.
Figures in this article are shown in US dollars with Indian rupee equivalents where useful, converted at approximately ₹83 per US dollar (€1 ≈ $1.09).
The CTO approved GitHub Copilot for 50 developers. Six months later, the CFO asks: “Did that $9,600 (₹8 lakh) spend actually make your developers faster?” The answer, in most firms, is: “We think so. The developers like it.”
That answer does not survive a budget review. It definitely does not survive a client asking whether you’ve passed on productivity gains in the form of faster delivery or lower billing rates.
The problem is not that developer productivity AI fails to deliver. The evidence is that it does. The problem is that software productivity has always been notoriously hard to measure - and AI tools have inherited that measurement problem without solving it.
This article explains how to measure AI ROI in an IT services context correctly.
Why Developer Productivity AI Is Different
In customer support or manufacturing, the link between AI tool and cost saving is direct:
- AI reduces AHT → fewer agent-minutes per ticket → lower cost
- AI predicts failures → fewer downtime hours → lower cost
In software development, the chain is longer and noisier:
- AI suggests code → developer accepts/rejects/modifies → code is merged/rejected → sprint velocity changes (or doesn’t) → delivery timeline changes (or doesn’t) → client satisfaction changes (or doesn’t)
Each link in that chain introduces variance. This is why naive measurements - “Copilot acceptance rate is 32%, therefore developers are 32% more productive” - are wrong and will be challenged immediately by any competent finance team.
The Right KPIs for IT Services AI
Uprovd’s IT Services vertical measures five KPIs that are directly attributable to AI tool deployment when measured against a locked baseline:
1. Story Points Delivered Per Sprint Per Developer
The most direct measure of developer velocity. Requires:
- A consistent sprint structure (2-week sprints, same estimation methodology)
- Story point data from your project management tool (Jira, Linear, Azure DevOps)
- A 90-day pre-AI baseline using the same teams and project types
What to watch for: Story point inflation. Developers sometimes unconsciously estimate larger when AI tools make delivery feel faster. Use historical story-point-to-hours ratios to calibrate.
2. Code Review Cycle Time
How long does a pull request take from opening to merge? AI tools that help developers write better first-draft code should reduce review iteration cycles.
Measurement: PRs opened and closed timestamps from GitHub/GitLab. Pre-AI median cycle time vs post-AI median cycle time. Filter out PRs open across sprint boundaries.
Typical result: 15–35% reduction in median review cycle time for teams using AI coding assistants consistently.
3. Bug Rate Per Story Point Delivered
If developers are moving faster but introducing more bugs, productivity gains are illusory - you’re spending the velocity gain on fixing defects.
Measurement: Bugs opened per story point delivered in the same sprint. Requires your QA team to tag bugs with the sprint they originated from.
What a good result looks like: Bug rate stays flat or decreases as velocity increases. This is the signal that AI tools are genuinely improving output quality, not just speed.
4. New Developer Onboarding Time to First PR
AI coding tools dramatically accelerate onboarding - new developers can ask the AI tool context questions that previously required bothering a senior developer. This is measurable and valuable.
Measurement: Days from start date to first merged PR, averaged across new hires. Compare pre-AI cohort vs post-AI cohort.
Note: This KPI requires 6+ months of post-deployment data to be meaningful. It is a longer-horizon signal than sprint velocity.
5. Documentation and Code Comment Coverage
AI tools generate documentation well. Teams that use them consistently produce better-documented codebases. This has real cost value - less time spent deciphering undocumented code in future sprints.
Measurement: Static analysis tools (SonarQube, CodeClimate) can measure comment density and documentation coverage. Compare pre/post deployment.
A Real Calculation: 120-Developer IT Services Firm, Pune
Here is how Uprovd measured AI ROI for a 120-developer IT services firm deploying GitHub Copilot and an AI code review tool across three delivery teams.
Pre-deployment baseline (90 days, Jul–Sep 2025):
- Average story points delivered per developer per sprint: 18.4
- Median PR cycle time: 3.2 days
- Bug rate: 0.8 bugs per 10 story points
- Fully-loaded developer cost: $1,020/month (₹85,000) per developer
Post-deployment measurement (Oct–Dec 2025, same teams, same project types):
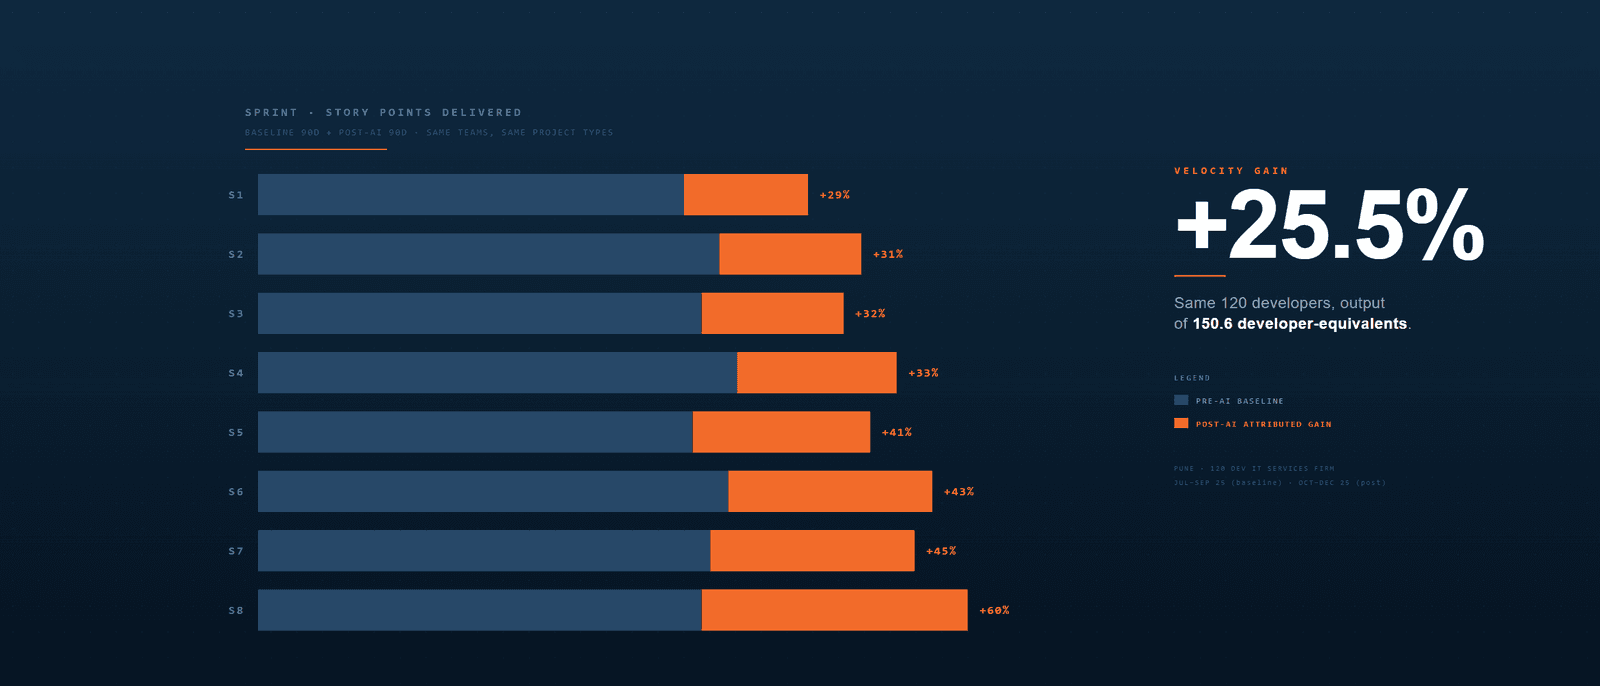
- Average story points delivered per developer per sprint: 23.1
- Median PR cycle time: 2.1 days
- Bug rate: 0.72 bugs per 10 story points
Velocity Calculation
Story point increase: 23.1 vs 18.4 = 25.5% improvement
This means the same 120 developers are now delivering the equivalent of 150.6 developers’ output. The “gained” capacity of 30.6 developer-equivalents at $1,020/month each:
30.6 developers × $1,020/month = $31,200/month in additional delivery capacity
This is not money the firm directly saves - it is additional capacity that can be deployed against new client work, absorb growth without new hires, or improve delivery margins.
The firm chose to use 60% of the capacity to absorb growth (avoiding 18 new hires that quarter) and 40% to improve delivery timelines on existing engagements.
Hiring cost avoided (18 developers not hired):
- Recruitment cost: $1,450 (₹120,000) per developer
- Onboarding cost (3 months at 50% productivity): $1,540 (₹127,500) per developer
- Total avoided per developer: $2,990 (₹247,500)
- Total avoided for 18 developers: $53,800 (₹44.6 lakh) one-time
Monthly ongoing saving (AI tools replacing hiring plan):
18 developers × $1,020/month = $18,400/month
Review Cycle Saving
PR cycle time reduction: 3.2 days → 2.1 days = 34% reduction
120 developers opening approximately 8 PRs each per sprint:
960 PRs/sprint × 1.1 days saved × 0.5 reviewer-days per PR = 528 reviewer-days saved/sprint
At $48/developer-day: $25,300 saved per sprint → $12,700/month
Summary
| Saving Category | Monthly Value | Confidence |
|---|---|---|
| Velocity gain (capacity created) | $18,400 | 0.81 |
| Review cycle time saved | $12,700 | 0.74 |
| Bug rate improvement (avoided rework) | $3,900 | 62/100 |
| Total monthly verified saving | $35,000 | - |
| AI tool cost (Copilot + review tool) | $4,340 | - |
| Net monthly saving | $30,660 | - |
| Net ROI | 707% | - |
| Payback period | < 4 weeks | - |
The high ROI is not unusual for developer AI tools in the Indian cost context. The tools are priced in USD (typically $10–$19/developer/month). Developer costs in India are a fraction of Western equivalents. The ROI arithmetic is extremely favourable.
The Most Common Measurement Mistake in IT Services
Measuring AI adoption rate instead of business outcome.
“78% of our developers use Copilot daily” is not a business metric. “Copilot users deliver 23% more story points per sprint than non-users, at the same bug rate, over the same 90-day period, on comparable project types” is a business metric.
The adoption metric is easy to get from the tool’s usage dashboard. The business metric requires the measurement infrastructure - the baseline, the controlled comparison, the cost translation - that most firms do not have.
This is exactly the gap Uprovd closes for IT services firms.
What the Uprovd IT Services Vertical Measures
When you connect Uprovd to your IT services operation, we pull data from:
- Jira / Linear / Azure DevOps - sprint velocity, story point delivery, bug tracking
- GitHub / GitLab / Bitbucket - PR cycle times, code review iterations, merge rates
- Your AI tool’s usage API - Copilot suggestion acceptance, AI-generated code proportion
- Your HR/payroll system or input - developer cost inputs for currency calculations
Against a locked pre-deployment baseline, we calculate the five KPIs above and produce a confidence-scored ROI report showing:
- Which AI tools are accelerating which teams
- Whether productivity gains are real or are being offset by quality degradation
- The dollar value of velocity gains in the context of your specific cost structure
- What to do next - expand, train, or reconfigure
The IT Services vertical is available to all Uprovd Professional and Enterprise plan customers. Try the demo to see the IT Services dashboard with real data.