
The statistic is everywhere now.
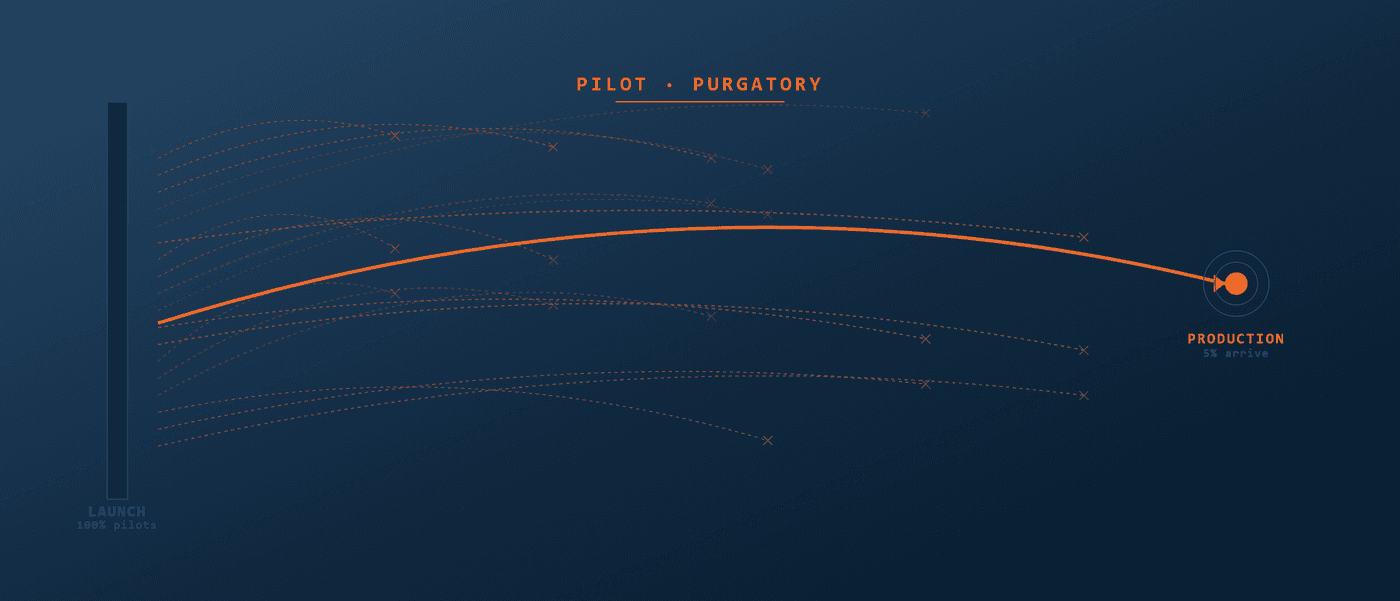
95% of generative AI pilots are failing. Not because the technology does not work. Because most companies cannot measure what matters. 1
It comes from MIT’s NANDA initiative, The GenAI Divide: State of AI in Business 2025, based on 150 executive interviews, a survey of 350 employees, and analysis of 300 public AI deployments 2.
The 95% number gets quoted in every board pack. The five reasons behind it get quoted far less often, which is unfortunate, because the reasons are where the fix lives.
This is what pilot purgatory actually looks like, and why so many organizations are stuck in it.
The Failure Pattern
Look at where the 95% fails, and the pattern is consistent:
- 42% of companies abandoned most of their AI projects in 2025 due to ROI uncertainty 1
- The average organization scraps 46% of AI proof-of-concepts before production 1
- Only 31% of AI use cases reached full production in 2025, double the 2024 rate, but still leaving 69% stuck in pilot or abandoned 1
- 88% of AI pilots never reach production at all, regardless of company size 3
The technology is not the problem. The MIT researchers are explicit on this point. Generic tools like ChatGPT work fine for individuals because they are flexible. They stall in enterprise use because they do not learn from or adapt to specific workflows 2.
The problem is that most pilots begin without defining what success means in measurable terms.
The Five Root Causes
The MIT NANDA research and our 2026 whitepaper converge on the same five structural failures. Together they account for nearly every failed pilot.
| Root Cause | % of Failed Pilots | What It Means |
|---|---|---|
| No pre-deployment baseline | ~68% | Cannot measure improvement without a reference point |
| Unclear success criteria | ~61% | Teams disagree on what “working” looks like |
| ROI methodology undefined | ~54% | Cannot translate KPI improvements to currency |
| Data quality / access | ~48% | Cannot get the data needed to calculate impact |
| Competing variable confusion | ~41% | Cannot isolate AI impact from other changes |
Source: 1
Each of these compounds the others. A pilot with no baseline cannot have clear success criteria. A pilot without ROI methodology - the value-and-cost side of AI governance - cannot get past the CFO. A pilot with bad data cannot survive its first audit.
Let’s take each one in turn.
1. No Pre-Deployment Baseline (68% of failures)
This is the single most common reason pilots fail. And it is the most preventable.
A baseline is a snapshot of performance before the AI tool is deployed. Average handle time before the chatbot. Defect rate before the vision AI. Developer velocity before Copilot. The baseline is the reference point against which every future claim of improvement is measured.
Without it, every improvement is anecdotal. “The team feels faster.” “Tickets seem to resolve quicker.” “The model is catching more defects.” Anecdotes do not survive budget reviews.
Most pilots skip the baseline because the team is excited to deploy the AI tool. They deploy it, then realize three months later they cannot prove anything because they have no “before” to compare against.
The fix. Lock the baseline before deployment. Record 30 to 90 days of pre-deployment performance for every KPI the AI is expected to affect. This is the single highest-leverage discipline in enterprise AI measurement.
2. Unclear Success Criteria (61% of failures)
What does “working” mean for a customer support chatbot? Different stakeholders give different answers:
- The support manager says: “Lower AHT.”
- The CFO says: “Lower cost per ticket.”
- The CX team says: “Higher CSAT.”
- The IT team says: “Lower escalation rate.”
If a pilot is deployed without picking one of these as the success criterion (and a target value for it), the project ends in disagreement. Some stakeholders declare victory. Others declare failure. Both are looking at the same data.
The fix. Define one primary success criterion per AI deployment, with a numeric target and a measurement window. “AHT reduction of 15% within 90 days, measured against the locked baseline.” Everything else is a secondary metric.
3. ROI Methodology Undefined (54% of failures)
This is where most pilots collide with finance.
The team produces an improvement metric: “AHT is down 18%.” The CFO asks: “What is that worth in dollars?” The team has no answer. Or three different answers from three different spreadsheets.
The conversion from KPI improvement to dollars is not difficult, but it must be defined in advance and applied consistently.
For customer support: time saved per ticket × tickets per month × fully-loaded agent cost per hour. For manufacturing: scrap rate reduction × units produced × scrap cost per unit. For developer productivity: velocity gain × developer count × fully-loaded developer cost.
The formulas are simple. The discipline of agreeing on the inputs before the pilot starts is what is hard.
The fix. For every pilot, document the ROI formula, the input variables, and the data source for each input. Get sign-off from finance before deployment, not after.
4. Data Quality and Access (48% of failures)
Even with a baseline and a clear ROI formula, a pilot fails if the team cannot get clean data to feed the calculation.
This is the most underestimated failure mode. The MIT NANDA researchers found that many GenAI pilots stall because they are connected to ungoverned data sources 4.
A typical example: a company connects an AI tool to a SharePoint repository containing ten versions of the same document. The AI randomly picks one. Outputs are inconsistent. Trust collapses. The pilot dies.
The fix. Audit data sources before deployment. Confirm the AI is reading authoritative, current, governed data. If it is not, fix the data layer first.
5. Competing Variable Confusion (41% of failures)
The trickiest failure mode. Even when everything else is in place, isolating AI impact from other simultaneous changes is hard.
A support team deploys an AI chatbot in March. In April, AHT drops 12%. Victory?
Not necessarily. In March, the team also:
- Hired three new senior agents
- Pushed a major knowledge-base update
- Onboarded a new client with simpler tickets
Which of those caused the 12% AHT reduction? Without controlled comparison, the answer is “we do not know.”
This is where the discipline of comparing AI-assisted vs non-AI-assisted tickets within the same period, on the same agents, on comparable ticket types, becomes essential. Otherwise the AI gets credit (or blame) for outcomes it did not cause.
The fix. Build comparison groups into the pilot design. AI-on vs AI-off. AI users vs non-users. Same agents, same period, same work types. This is the difference between correlation and attribution.
A Real Example
The MIT NANDA report documented a financial services firm that ran a pilot using GenAI to summarize loan application documents 5.
The summaries looked reasonable. The pilot team declared success. The pilot was scheduled for production rollout.
Then the compliance team reviewed the outputs. They found that the model occasionally omitted critical risk flags buried in dense paragraphs. The pilot had measured surface-level success (readable summaries) without measuring the business-critical metric (risk flags captured).
The pilot was paused. A new measurement framework was introduced: every summary scored against the original document for completeness on a defined list of risk indicators. Only after this measurement layer was added did the pilot become viable.
This is the pattern. The technology was capable. The pilot was deployed. The measurement infrastructure was missing. Once it was added, the project moved from purgatory to production.
What the 5% Get Right
The same MIT research that produced the 95% number also identified what the 5% of successful pilots have in common.
Purchasing AI tools from specialized vendors and building partnerships succeeds about 67% of the time. Internal builds succeed only one-third as often 2.
Other factors that separate the 5% from the 95%:
- Pilots run on back-office workflows (finance, compliance, document processing) outperform pilots run on sales and marketing, despite most budget going to the latter
- Pilots that empower line managers to drive adoption beat pilots run by central AI labs
- Pilots with deep workflow integration beat copilots bolted onto existing systems
- Pilots run by organizations that have fundamentally redesigned workflows around AI are 3× more likely to scale successfully 1
The common thread: the 5% treat AI as an operational discipline, not an experiment. They begin with the measurement framework. They redesign the workflow. They concentrate investment on fewer, deeper deployments.
A Five-Step Escape Plan
The whitepaper’s five-step framework was designed for exactly this problem. Apply it to any pilot stuck in purgatory:
-
Lock the baseline before deployment. If the pilot is already deployed without a baseline, reconstruct one from historical data if possible. If not, run a controlled re-baseline period.
-
Define the measurement unit before deployment. Pick one primary KPI. Set a numeric target. Agree the window.
-
Map AI events to business KPIs. Document the causal chain from AI action to business outcome. This makes attribution defensible.
-
Assign a confidence score to every calculation. Not all ROI numbers are equally reliable. Showing the confidence level alongside the number builds CFO trust.
-
Produce stakeholder-appropriate outputs. The CFO needs net ROI and payback period. The Operations Head needs KPI delta by team. The CTO needs tool-level cost vs performance. Same data, different presentations. 1
The Bottom Line
Pilot purgatory is not a technology problem. It is a measurement problem.
The 95% failure rate is real. So is the fact that it traces back to five preventable causes, every one of which can be addressed before deployment.
The five reasons pilots fail are also the five questions every enterprise should answer before approving the next AI deployment:
- What is the baseline?
- What does success look like, in numbers?
- How will we convert KPI improvement to dollars?
- Is the data we need clean and accessible?
- How will we isolate AI impact from other changes?
If you cannot answer all five, you are not running a pilot. You are running an experiment in optimism.
Read next
This analysis is built on our 2026 research synthesis. For the complete framework, global benchmarks, and full bibliography, read The AI Adoption Reality Check, 2026 Uprovd Research Whitepaper.
To see how the five-step framework works on live data, try the demo.
References
- 01 Uprovd Research · 2026 The AI Adoption Reality Check: When Investment Outpaces Measurement Read the whitepaper →
- 02 MIT NANDA Initiative · 2025 · via Fortune The GenAI Divide: State of AI in Business 2025 fortune.com/mit-report →
- 03 Folio3 AI · 2026 AI Project Failure Rate in 2026: What the Data Shows folio3.ai/blog/ai-project-failure-rate-stats →
- 04 Dawiso · 2025 Why 95% of GenAI Pilots Fail: The Hidden Data Crisis Behind AI dawiso.com/why-95-percent-of-genai-pilots-fail →
- 05 EC-Council · 2026 Why GenAI Pilots Fail & How Program Managers Fix It eccouncil.org/why-genai-pilots-fail →