
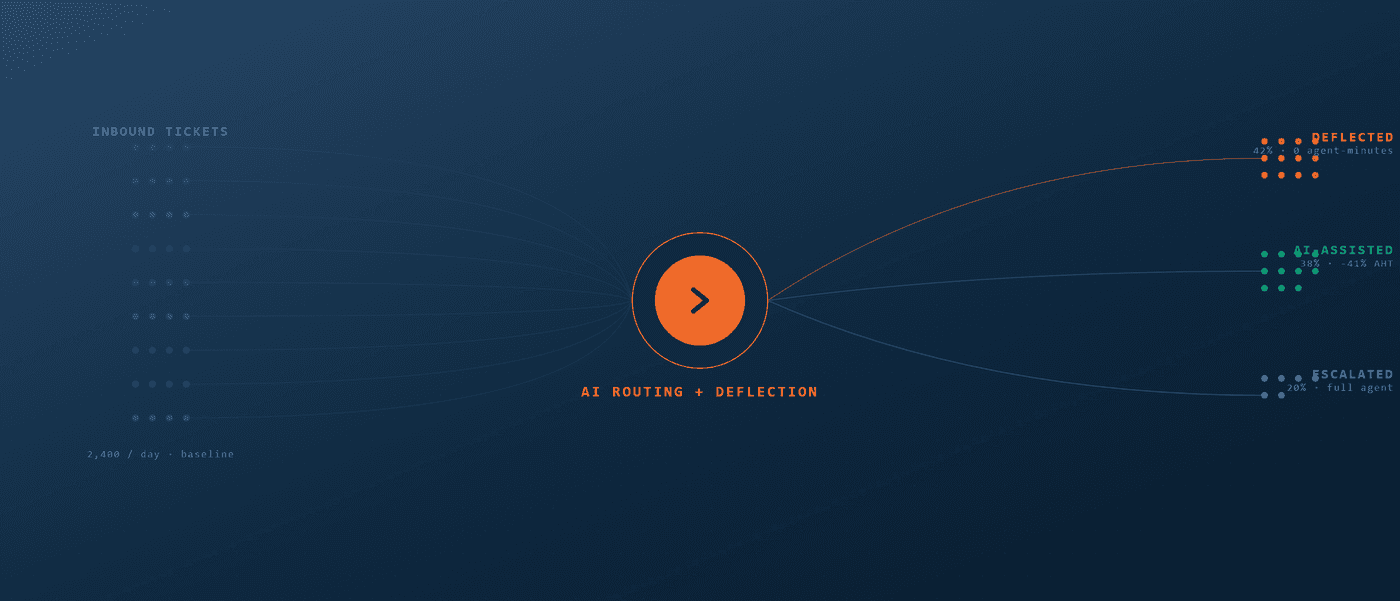
This is a scenario analysis using realistic industry baselines, not a verified customer engagement. Uprovd’s first real case studies will appear after our Founding Customers complete their pilots in Q3 2026.
Figures in this case study are shown in US dollars with Indian rupee equivalents where useful, converted at approximately ₹83 per US dollar (€1 ≈ $1.09).
The Scenario
A 200-agent business process outsourcing firm deploys three AI tools over a 90-day window:
- AI-assisted response generation - suggesting complete reply drafts to agents during live chat interactions
- Ticket classification AI - automatically tagging and routing inbound tickets by type and priority
- AI quality monitoring - scoring agent responses for quality compliance against a rubric
Total monthly AI tool cost: $5,060 (₹4.2 lakh)
The operations head needs to answer one question for the board review: “Is this $5,060 per month working?”
Without a measurement methodology, nobody can answer it. This is the problem Uprovd solves.
What the Uprovd Methodology Would Do
The first task is establishing a baseline. In a real engagement, if no pre-deployment baseline was captured, Uprovd works with the client’s historical ticketing system data to reconstruct 90 days of pre-AI performance.
Example reconstructed baseline (90 days before AI deployment):
- Average Handling Time: 8.2 minutes
- Tickets per agent per day: 42
- First Contact Resolution rate: 67%
- CSAT score: 3.8/5.0
- Cost per ticket (fully loaded): $0.57 (₹47)
Post-deployment measurement (after 90 days):
- Average Handling Time: 6.9 minutes
- Tickets per agent per day: 42
- First Contact Resolution rate: 71%
- CSAT score: 4.1/5.0
- Cost per ticket: $0.53 (₹44)
What the Numbers Would Show
Tool 1: AI-Assisted Response Generation
The response generation tool drives the majority of measurable impact in this scenario.
AHT reduction of 1.3 minutes per ticket, at 200 agents handling roughly 42 tickets/day each, valued at a fully loaded agent cost of $0.035 (₹2.9) per agent-minute (a composite ~$340/month agent salary × 1.3 loading factor ÷ 26 days × 8 hours × 60 minutes ≈ $0.035):
Monthly tickets: 220,000 (≈8,460/day across 200 agents)
Time saved: 220,000 × 1.3 min = 286,000 agent-minutes/month
At $0.035/agent-minute: $10,010/month - call it $10,000 gross (₹8.3 lakh)
Tool cost: $1,450/month
Net saving: $10,000 − $1,450 = $8,550/month
Net ROI: 590%
Example confidence score: 87 / 100. Score reflects: six months of consistent post-deployment data, stable agent mix, consistent ticket volume.
Tool 2: Ticket Classification AI
The classification tool’s ROI is smaller but real in this scenario.
Routing accuracy improving from 74% to 86.5% means 12.5% fewer tickets are mis-routed.
Monthly mis-routes before AI: 220,000 × 26% = 57,200
Monthly mis-routes after AI:  220,000 × 13.5% = 29,700
Reduction: 27,500 tickets not mis-routed
Each mis-route costs approximately 4 additional minutes
Time saved: 27,500 × 4 min = 110,000 agent-minutes/month
At $0.035/agent-minute: $3,850/month saved
Tool cost: $960/month
Net saving: $2,890/month
Net ROI: 301%
Example confidence score: 74 / 100. Routing accuracy measurable directly from the ticketing system. Lower score reflects shorter measurement window.
Tool 3: AI Quality Monitoring - The Important Finding
This is the finding that changes the decision.
The quality monitoring tool generates 1,200 agent performance scores per week. But the CSAT improvement (3.8 → 4.1) cannot be attributed to the quality monitoring tool - it correlates more strongly with a supervisor coaching programme running in parallel.
When Uprovd isolates the quality monitoring tool’s contribution, controlling for the coaching programme timing:
Attributable CSAT improvement: 0.1 points (not statistically significant)
Cost avoided from quality improvement: $0 (no measurable cost metric attached to CSAT)
Time cost of reviewing 1,200 scores/week: 6 supervisor-hours/week
Supervisor cost: $14.50/hour
Monthly supervisor time cost: $348
Tool cost: $2,650/month
Total monthly cost of this tool: $2,998
Measurable ROI: -100% (no verified positive return)
Recommendation the methodology would surface: Cancel the quality monitoring tool. Redirect the $2,650/month (₹2.2 lakh) to expand the response generation tool to the night shift team.
Summary
| Tool | Monthly Cost | Illustrative Saving | Scenario ROI |
|---|---|---|---|
| Response Generation AI | $1,450 | $10,000 | 590% |
| Ticket Classification AI | $960 | $3,850 | 301% |
| Quality Monitoring AI | $2,650 | $0 | –100% |
| Total | $5,060 | $13,850 | 174% net |
The most important outcome in this scenario is not the $13,850 (₹11.5 lakh) in potential monthly savings. It is the $2,650 per month in waste that the methodology identifies and stops.
This is what Uprovd does: it surfaces which tools are earning their cost and which are not - with confidence scores on every figure.
Want to be the first real case study? Uprovd is selecting 5 Founding Customers to pilot the platform on real data. Apply to our Founding Customer Program →